
In this tutorial, we will debug the simple SPI application from Tutorial 24.
Configuring Linux for Debugging
SDK talks to a debug server that runs on the ZedBoard. We need to modify our Linux build to turn on the debug server. First, run petalinux-config, as shown in Tutorial 23:
% petalinux-config -c rootfs --project zedboard_linux
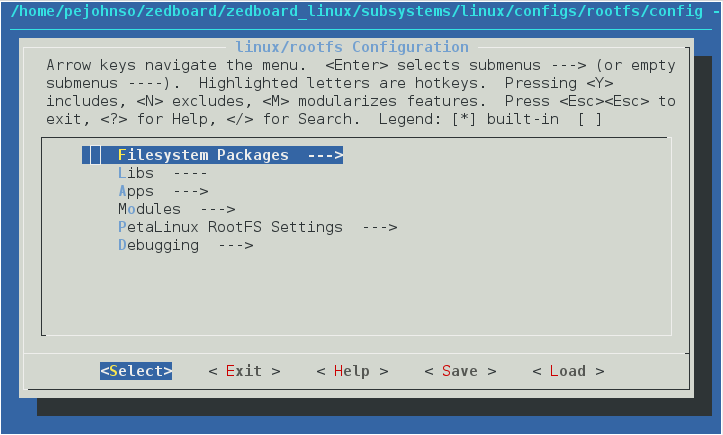
Press return to select Filesystem Packages.
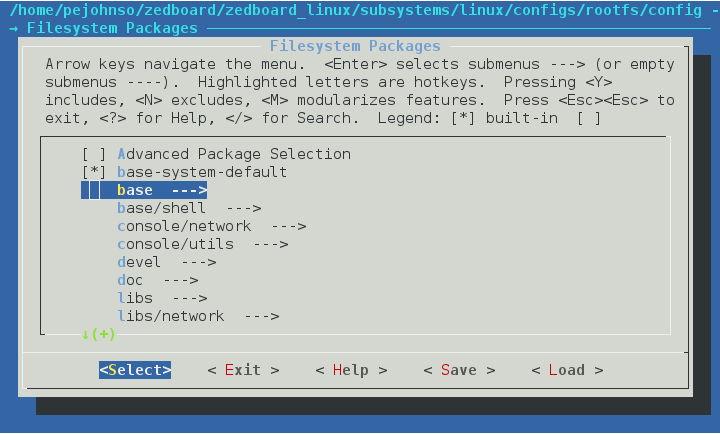 Then, use the arrow keys to select base, and press return.
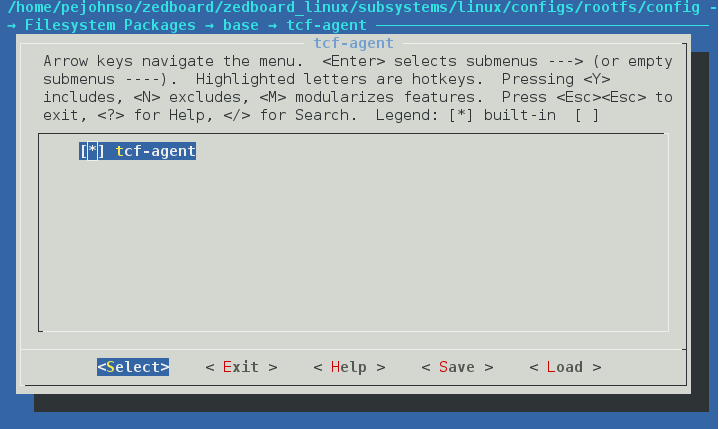
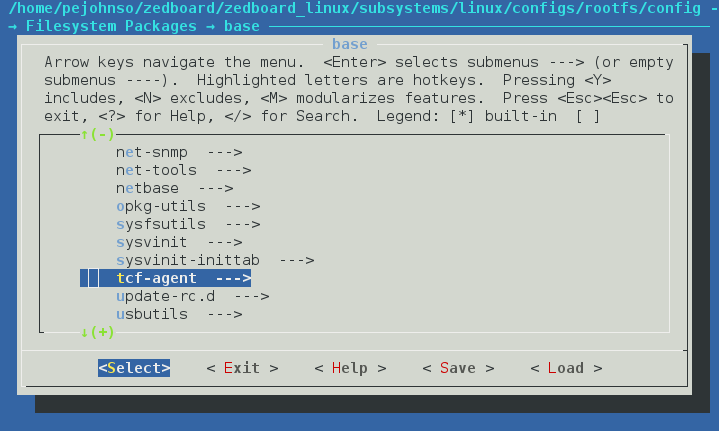 Press return to select the tcf-agent option, then press space to enable it.
 Then use the arrow keys to save and exit back out of petalinux-config.
Then run petalinux-build and petalinux-package as shown below to build the kernel and filesystem and package it for copying to the SD card.
→% petalinux-build --project zedboard_linux
% petalinux-package --boot --format BIN --project zedboard_linux \
--format BIN \
--fsbl zedboard_spi/zedboard_spi.sdk/Zynq_FSBL/Debug/Zynq_FSBL.elf \
--fpga zedboard_spi/zedboard_spi.runs/impl_1/system_wrapper.bit \
--u-boot
After you have packaged the distribution copy, the BOOT.BIN, and zedboard_linux/images/linux/image.ub files to the SD card,
place the SD card back in the ZedBoard and reboot.
Building the application in SDK
Form Vivado, export the FPGA design to SDK by selecting File→Export Hardware. Check the Include bitstream option and click OK. Now launch SDK by selecting File→Launch SDK, then clicking OK.
Once in SDK, create a new application project by selecting New→Application Project. Set the project name to max5216pmb1 and the OS Platform to linux, then click Next. Choose the Linux Empty Application template and then click Finish. This will create a new application project. We’re going to import the code from the previous tutorial to this project. Select File→Import…. Expand the General category and select File System, then click Next. Click Browse and go to the directory which contains the max5216pmb1.c file. Remember that you need to select the directory containing the file. Don’t browse into the directory. Once you have selected the directory, click OK. You will now be presented with a screen showing all the files in the directory you selected. Check the max5216pmb1.c file. Change the Info folder field to max5216pmb1/src so that the file is imported into the src folder within the project. Now click Finish.
With the code successfully imported, SDK will try to compile the project. This will fail with link errors. We need to link with the math library so we will set that up now.
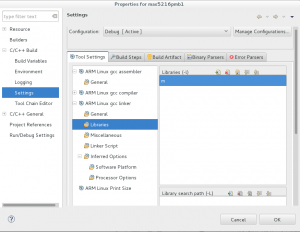 Select the max5216pmb1 project in the Project Explorer pane, then select Project→Properties. Expand the C/C++ Build field and select the Tool Settings tab. Now, expand the ARM Linux gcc linker field and select Libraries. Click on the button with a plus sign and page and enter m for the library name. Your dialog box should look like that shown on the right. Click OK to dismiss the dialog box. The project should now link properly.
Configuring the Target Connection
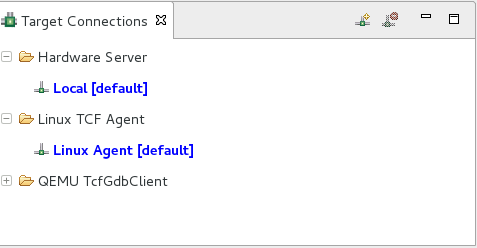 We need to tell the debugger how to communicate with our ZedBoard. This communication channel is called a Target Connection. You should see a window pane in the lower left of the SDK window called Target Connections. If you don’t, you can make it show up by clicking Window→Show View→Other, then selecting Target Connections and clicking OK. The Target Connections panel is shown to the right. Select the Linux Agent [default] entry and right-click and select Edit from the popup menu. Enter in the IP address for your ZedBoard in the Host field. Make sure the port is set to 1534. Then click OK. This configures SDK to talk to the TCF debug daemon on your ZedBoard over the Ethernet connection.
Configure the debug session
We now need to configure the debug session. Select the max5216pmb1 project and select Run→Debug Configurations. Select Xilinx C/C++ application (System Debugger) and click the new ![]() button. This will create a new debug configuration called max5216pmb1 Debug. In the Target Setup tab, set Debug Type to Linux Application Debug. The Connection field should be set to Linux Agent. Next in the Application tab use the Browse button to set the Project Name to max5216pmb1. The Application Local File Path will be automatically set to Debug/max5216pmb1.elf. We also need to set the Remote File Path to /home/root/max5216pmb1.elf. Now click Apply set set the changes and then click Run. This should bring up a debugger view and start the debugger.
button. This will create a new debug configuration called max5216pmb1 Debug. In the Target Setup tab, set Debug Type to Linux Application Debug. The Connection field should be set to Linux Agent. Next in the Application tab use the Browse button to set the Project Name to max5216pmb1. The Application Local File Path will be automatically set to Debug/max5216pmb1.elf. We also need to set the Remote File Path to /home/root/max5216pmb1.elf. Now click Apply set set the changes and then click Run. This should bring up a debugger view and start the debugger.
You should be able to step through the program and step into function calls. The Console panel at the bottom of the SDK window will show program output. You can type program input there as well, just as you would do from the console.